Track project progress visually with the best Gantt chart software
FlexiProject helps you track variances, manage dependencies, control dates, and monitor the critical path with a Gantt Chart.
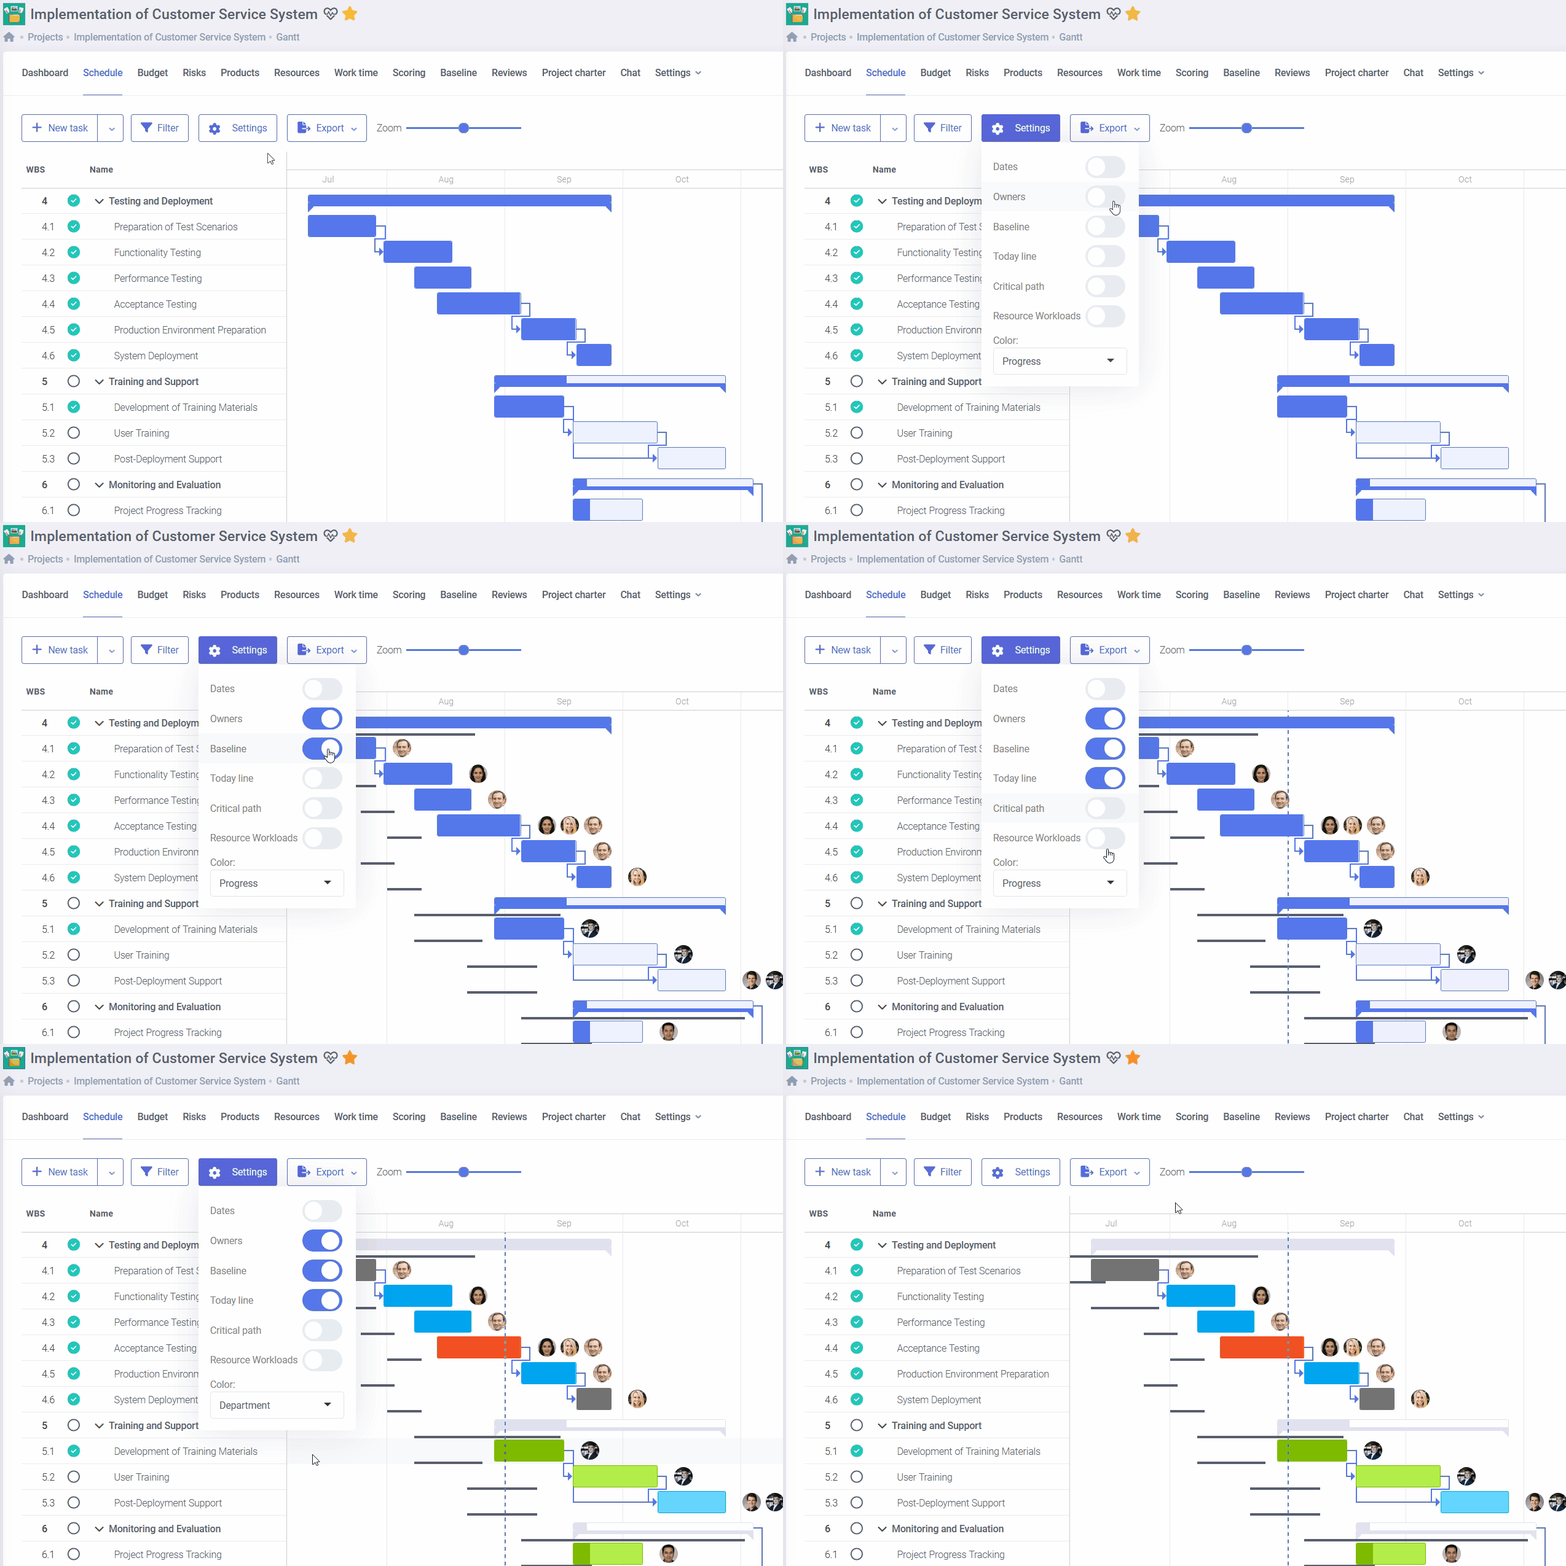
Customize the Gantt chart to fulfill your specific requirements
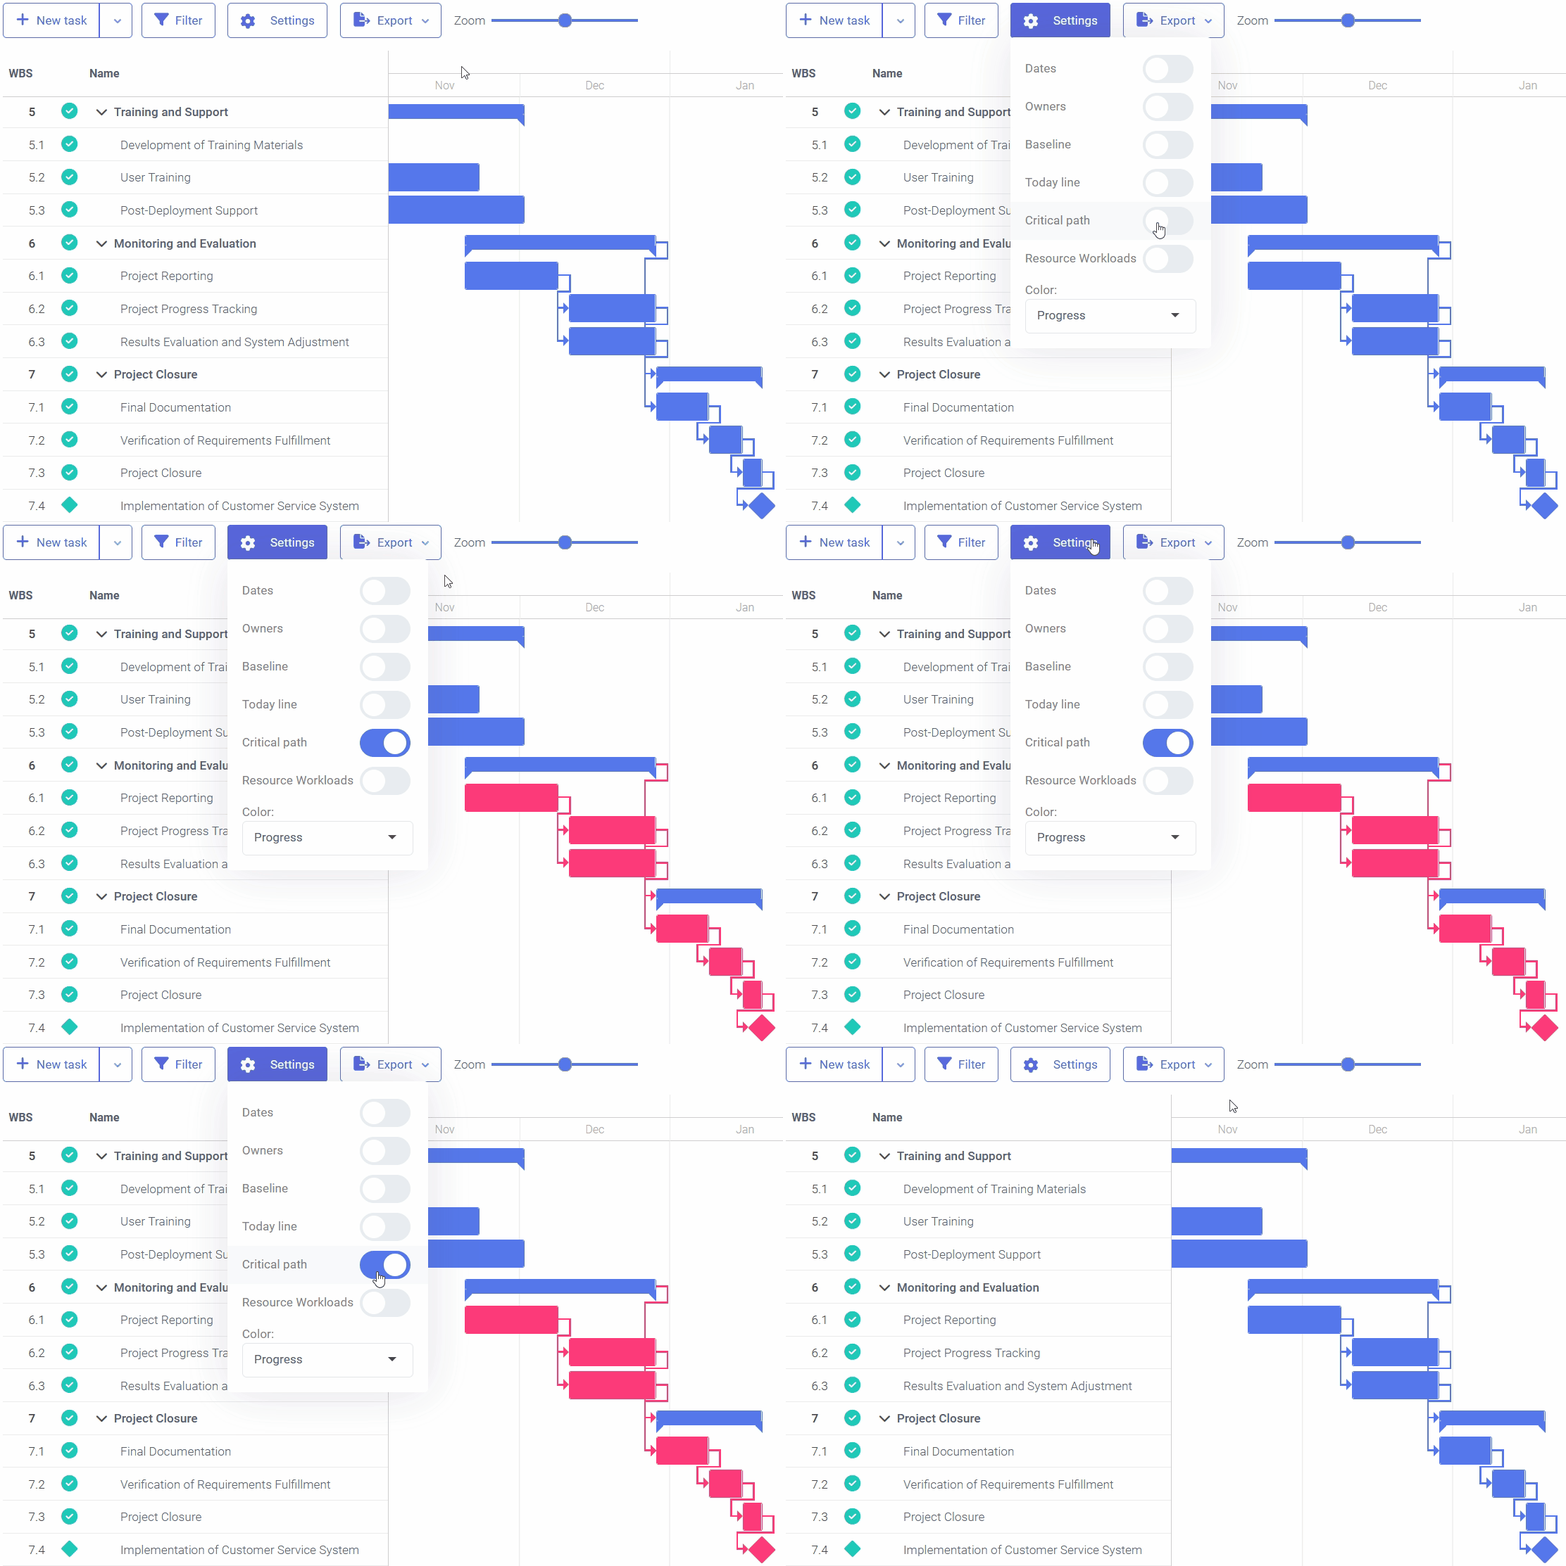
You can adjust the Gantt Chart according to your specific needs. You can show important details such as the approved baseline plan, task dates, responsible persons, and critical path. FlexiProject allows for easy resizing of the chart, so you can make it convenient to read and have complete control over your project.
Build relations between tasks
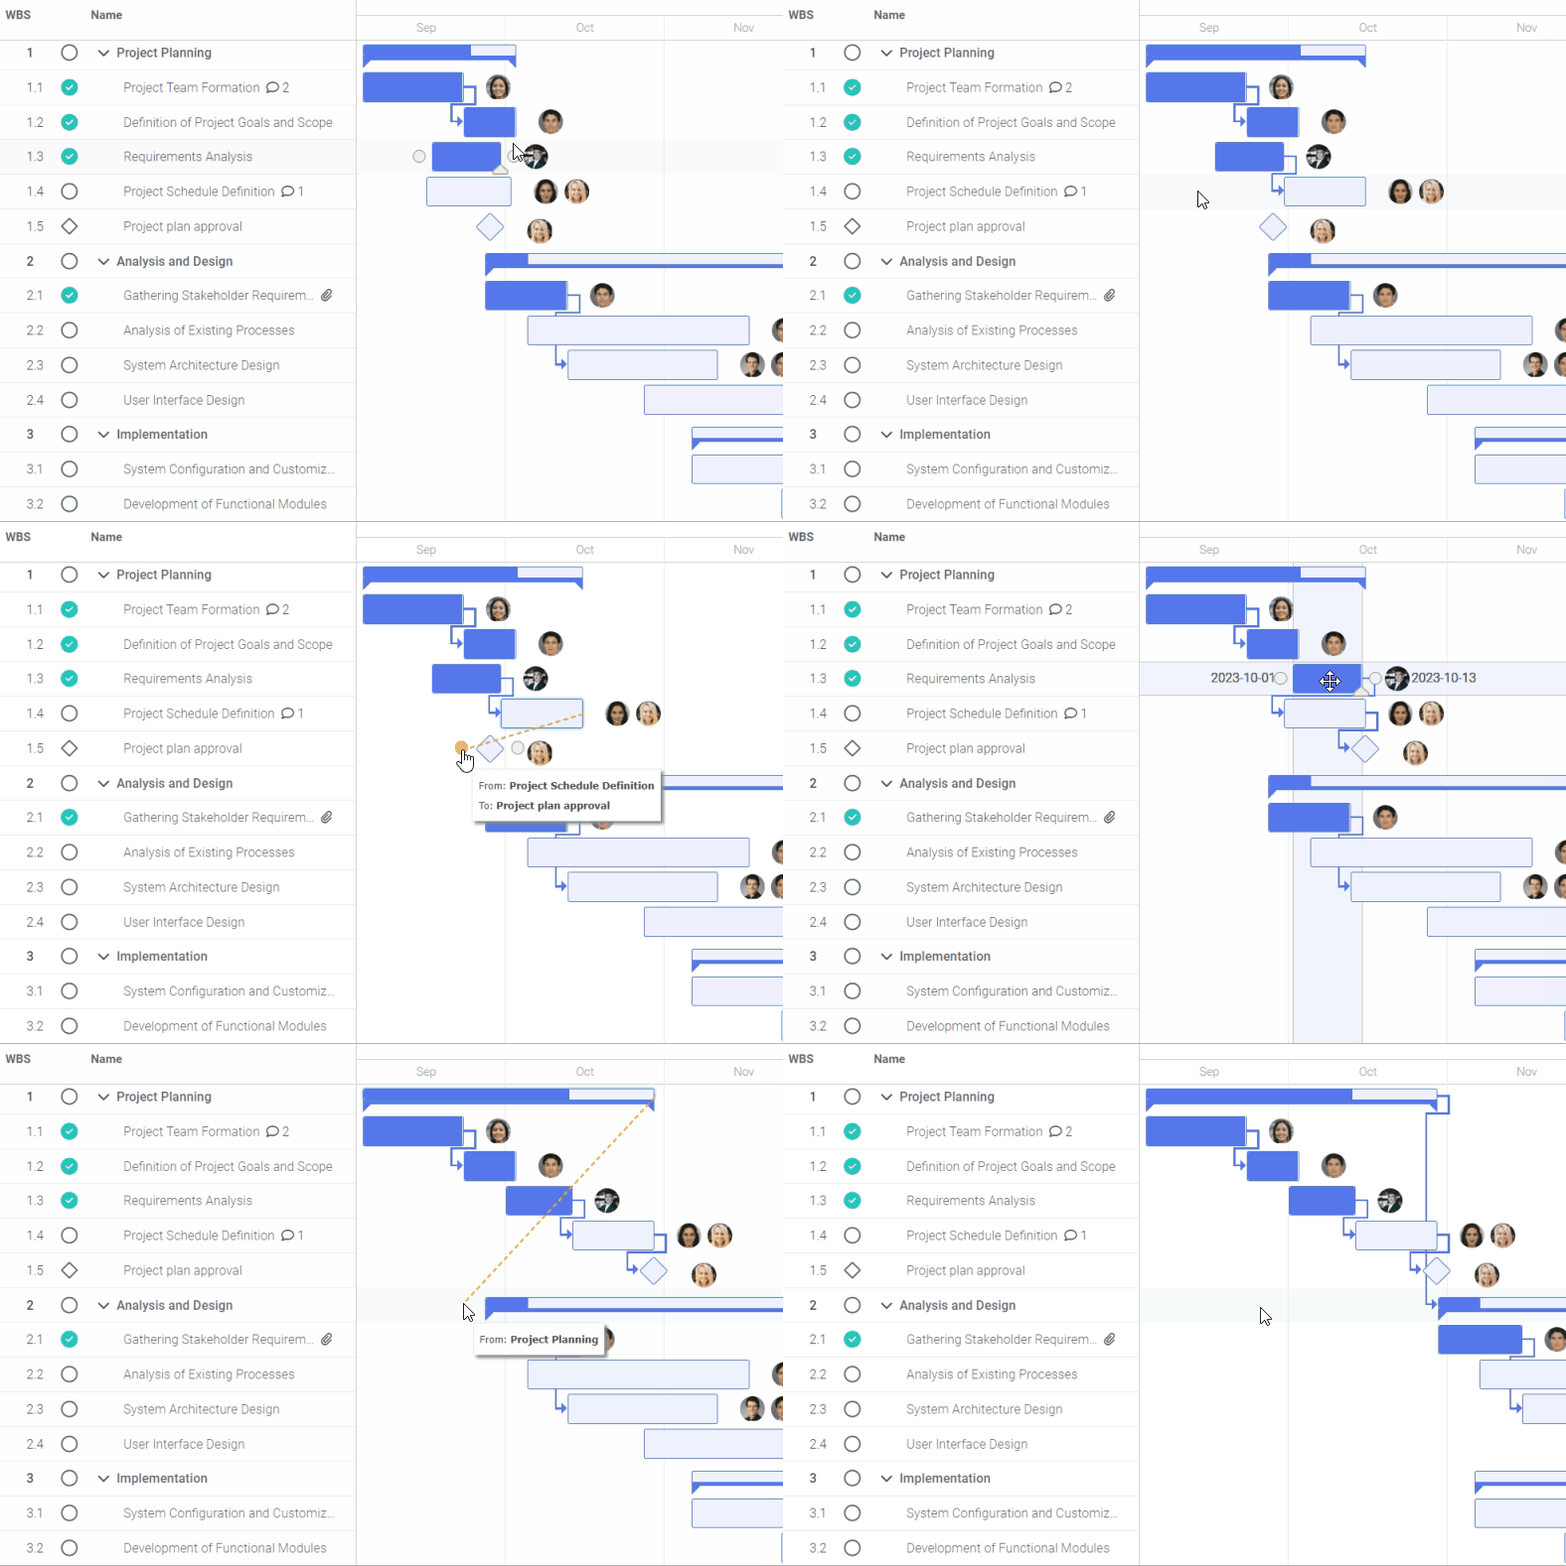
On a Gantt Chart, you can quickly establish various relations between tasks. Additionally, FlexiProject enables you to create relations between different phases and stages of a project.
Once you have established relations, the software will ensure that the schedule is logical and consistent. If the previous task is completed, the owner of the next task will be notified.
Create complete project schedules with AI
Turn an idea into a ready-to-execute project plan in just a few minutes. Simply describe your project goals and requirements, and AI will automatically generate a schedule with tasks, milestones, dependencies, and a Gantt chart.
Get a strong starting point and accelerate planning for even the most complex projects. The generated schedule can be freely edited, expanded, and tailored to your organization’s processes, helping teams save time, improve consistency, and start delivering value faster.

Unlock all FlexiProject features with 30 days of full access — completely free! Discover AI-powered planning and see how quickly you can turn ideas into actionable project plans.
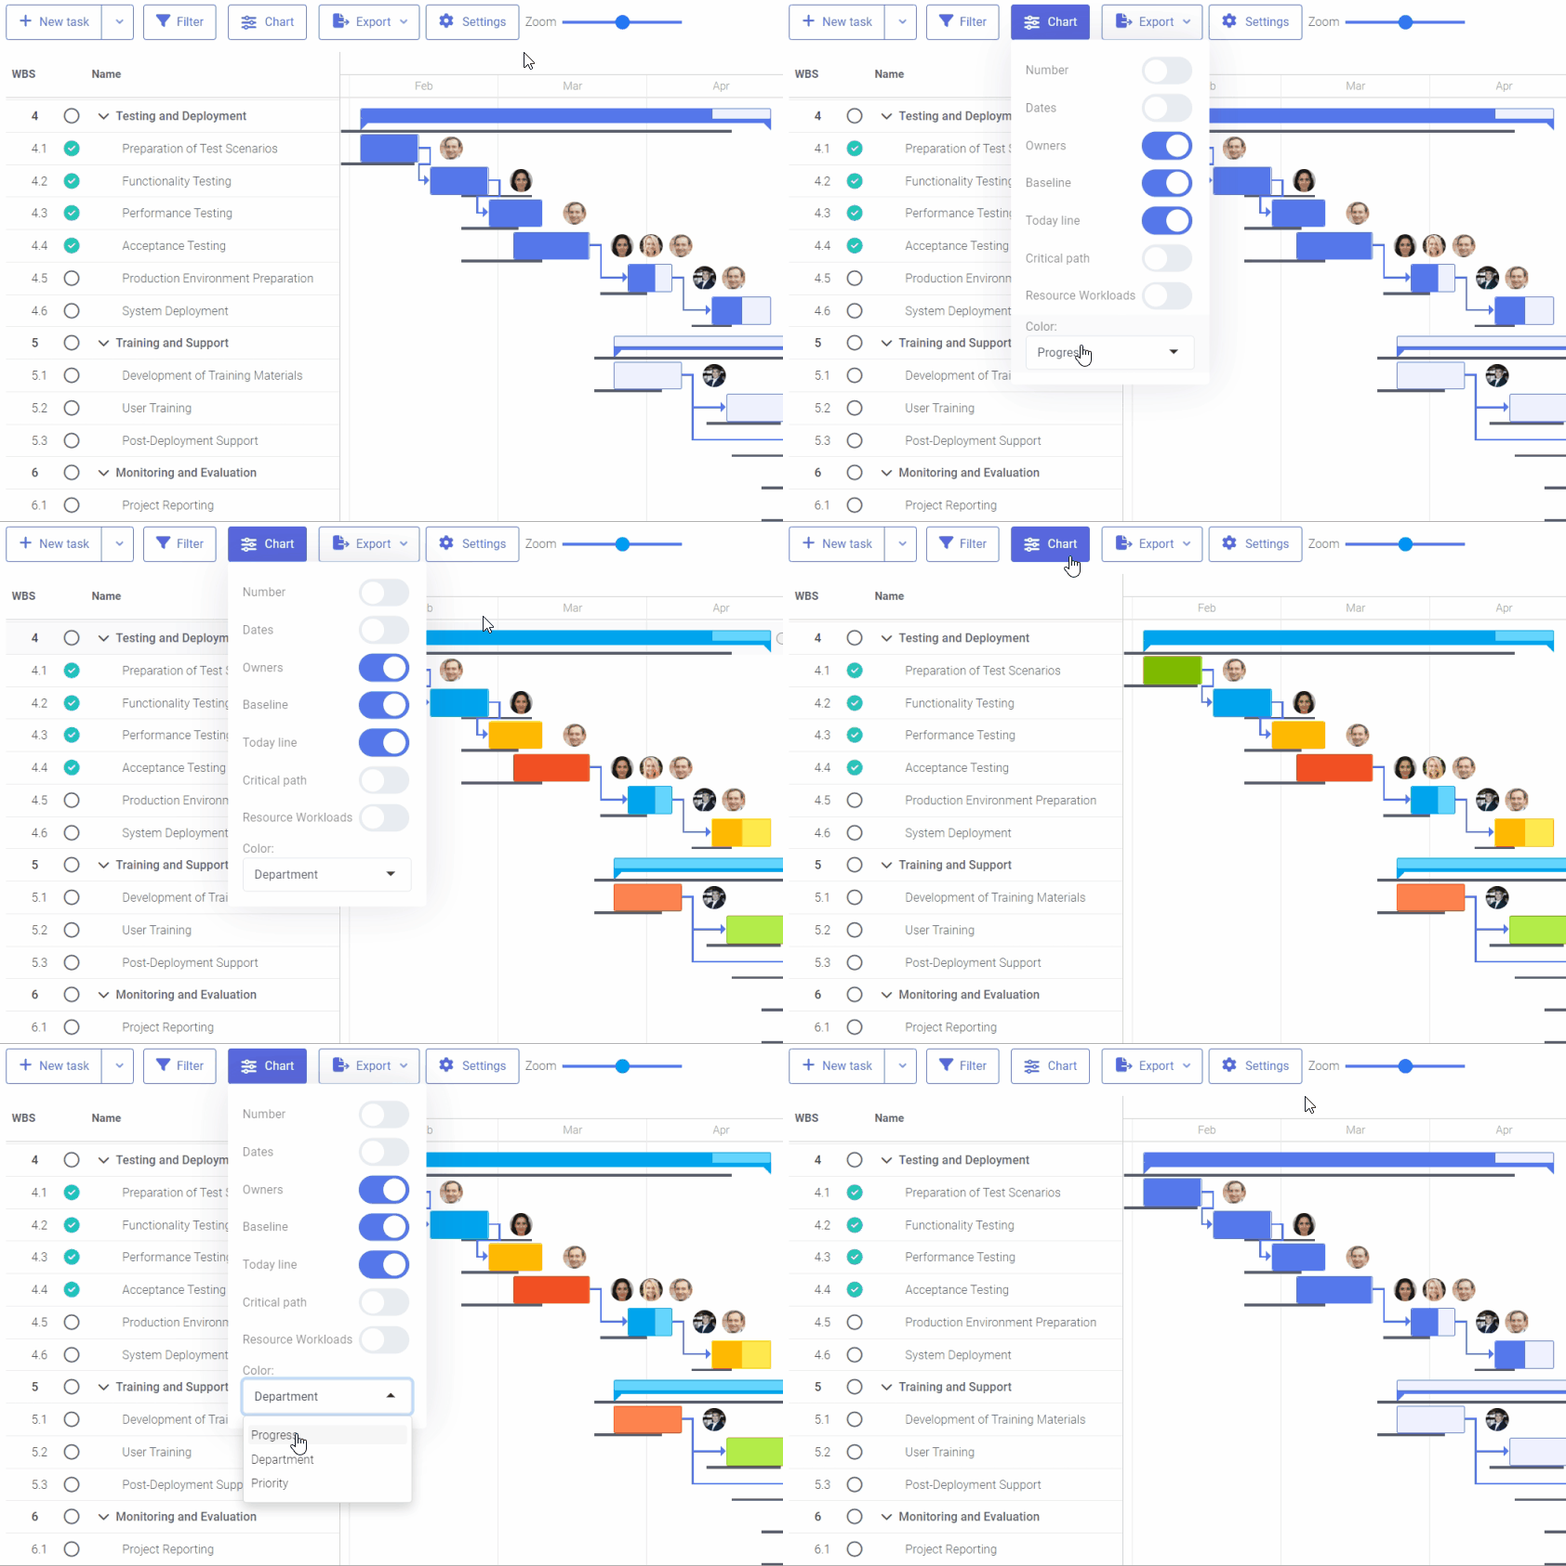
Choose the color scheme based on your preferences
When visualizing data such as task priorities or tasks from different organizational departments, it’s helpful to choose distinct colors. For instance, Production Department employees can assign a green color to their tasks, while the Sales Department can choose a contrasting color.
This approach ensures that the same color applies to all organizational projects.
Observe variances from the plan
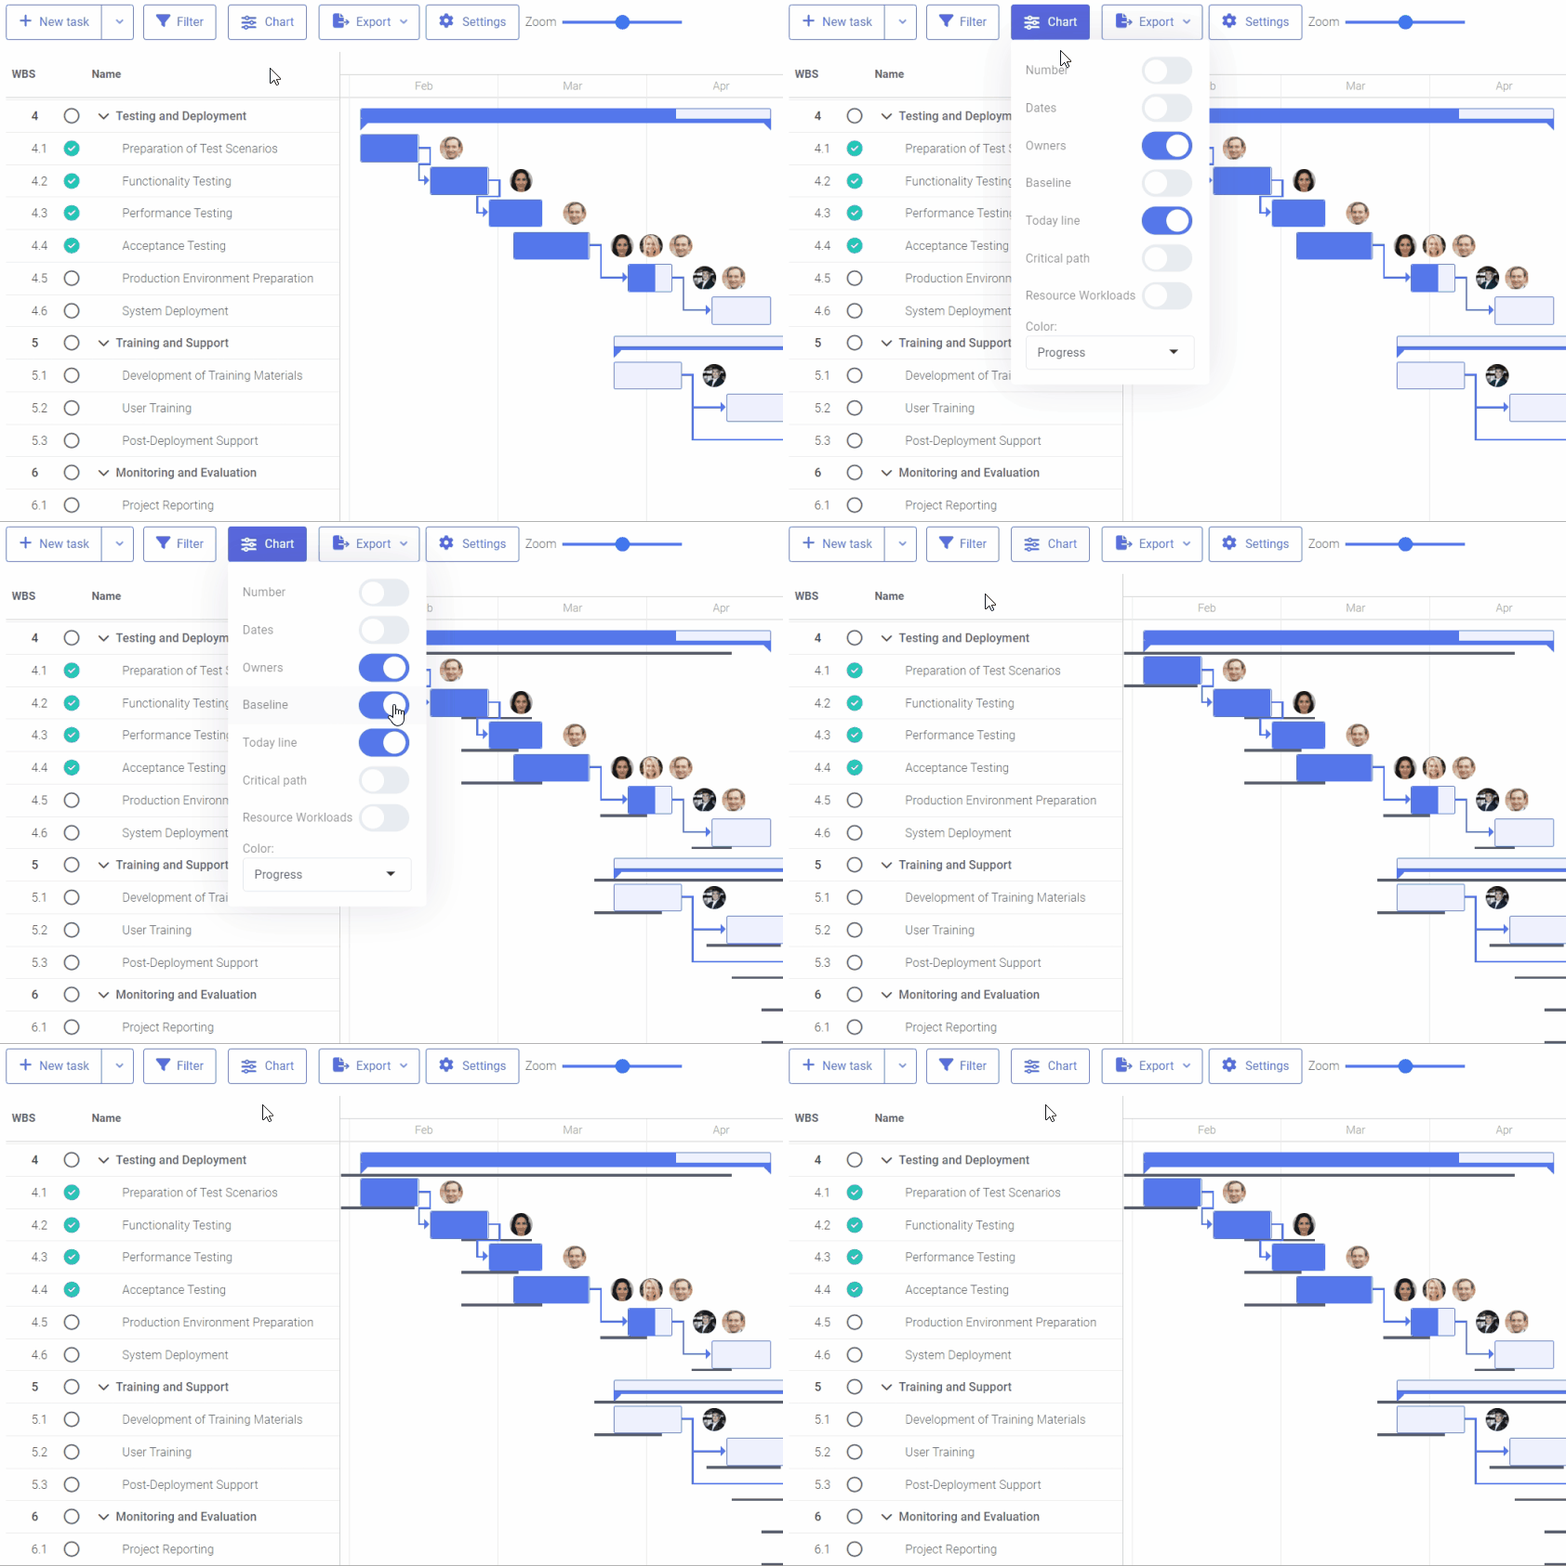
With FlexiProject, you can easily view the approved baseline on a Gantt Chart. This will enable you to track the actual forecast of each task’s completion and compare it with the approved plan.
By doing so, you can determine the variance from the approved plan. You can also see the current forecast of the completion date for the entire project against the plan.
Manage the critical path
The critical path can be displayed on the Gantt Chart. The tasks that are part of the critical path will be highlighted in red, which will help you identify the most essential elements of the schedule.
By closely monitoring these tasks, you can ensure you can complete the project on time.
Use a Gantt chart to manage your schedule
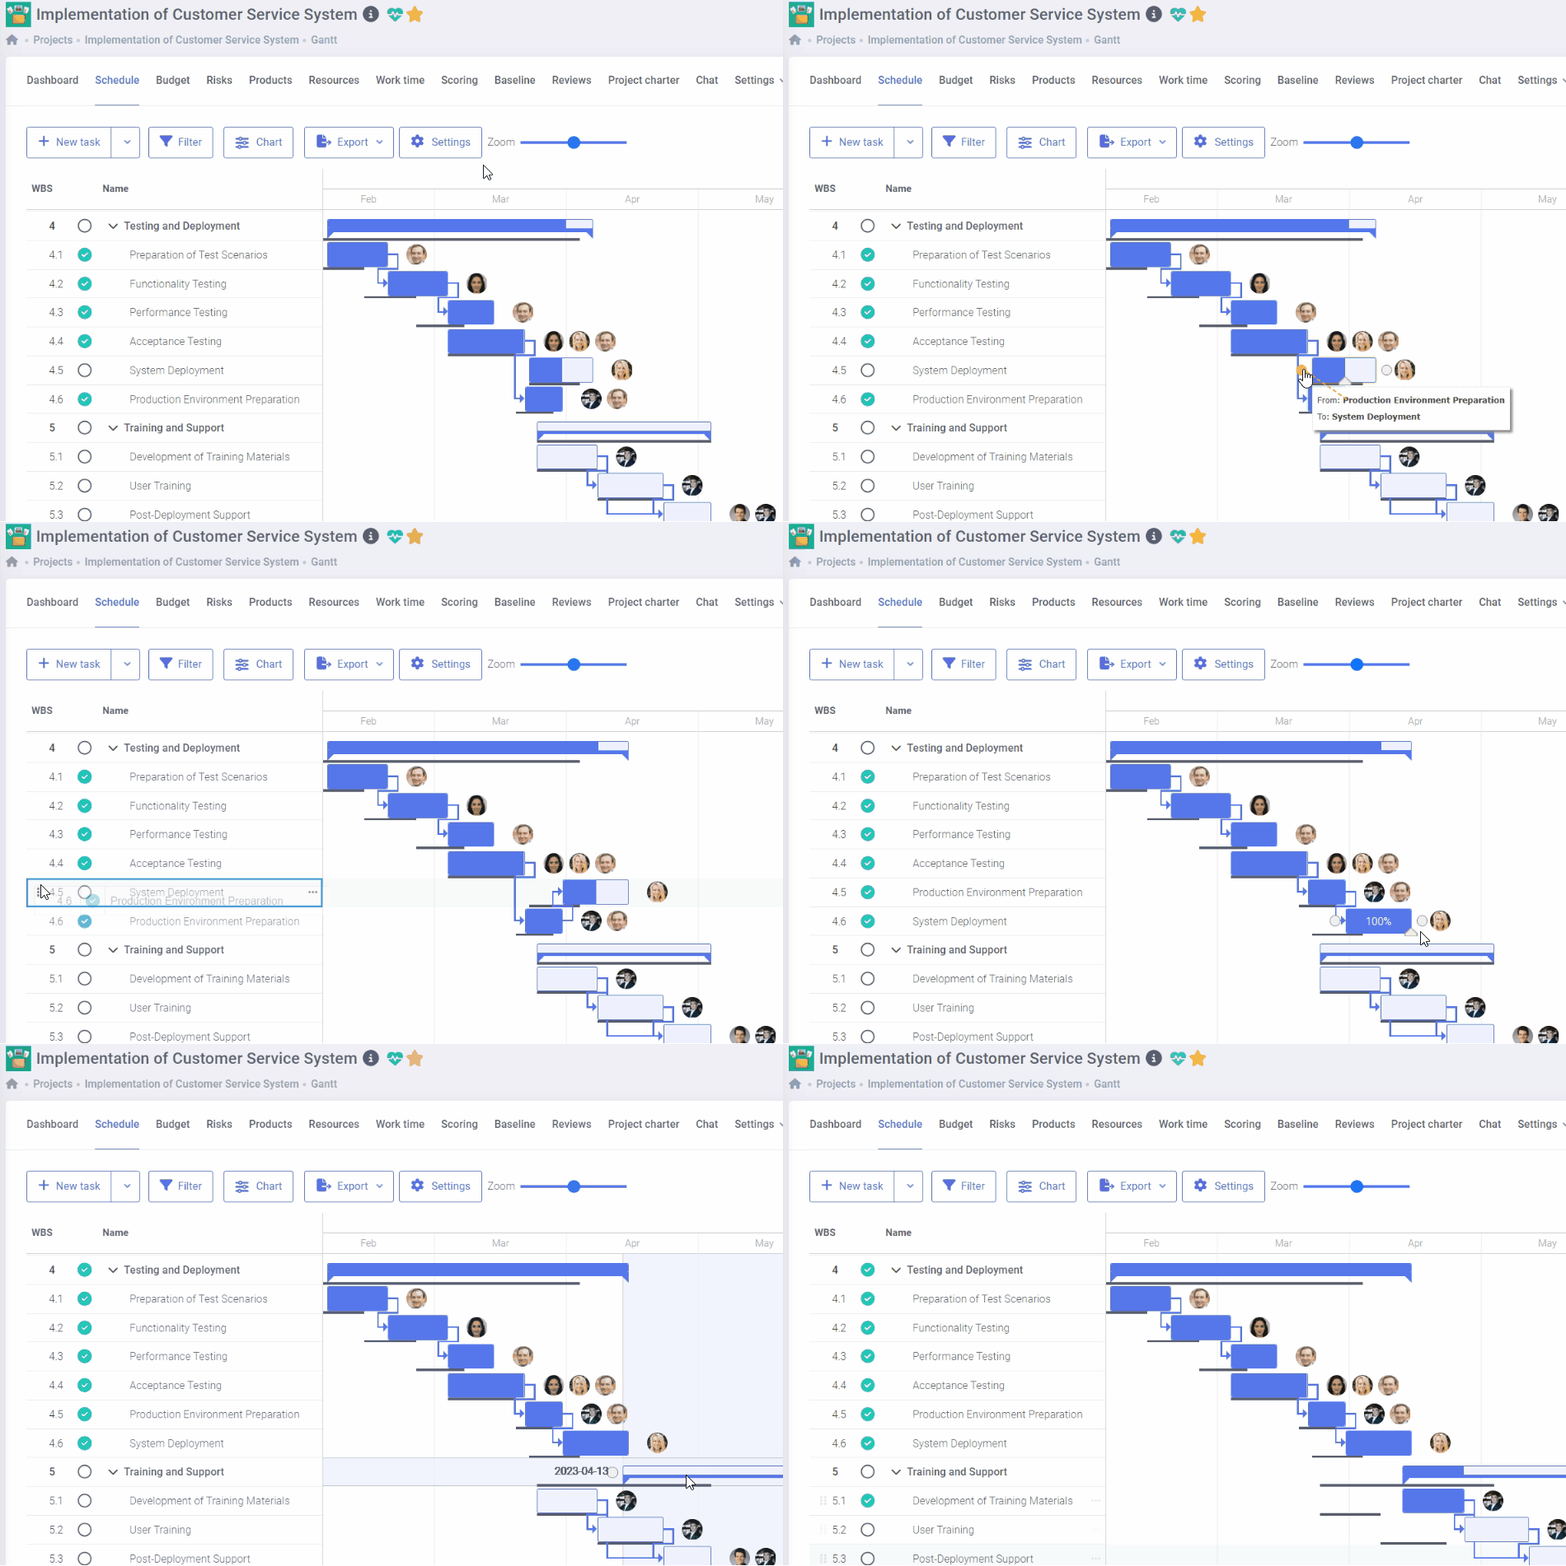
Work on a fully interactive Gantt Chart. Create new tasks, manage their order, build dependencies between tasks, determine the progress of tasks, and decide on the actual start and end dates.
You can easily time-shift an entire project, phase or stage along with assigned tasks and milestones.
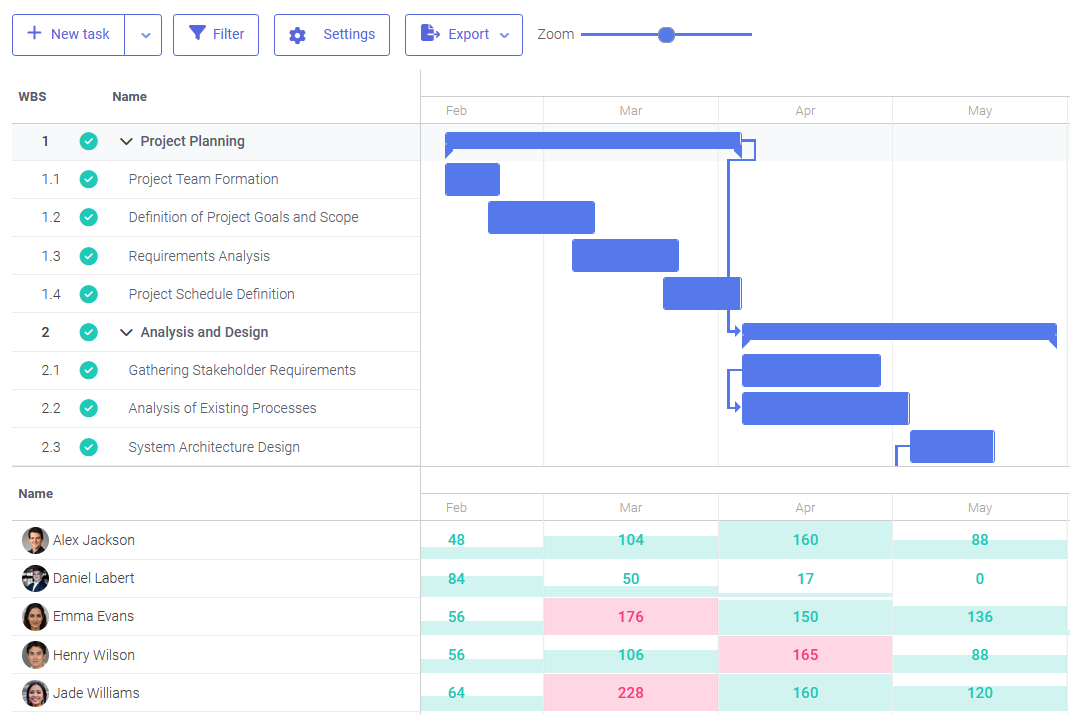
Observe resource utilization from a Gantt chart
The Gantt Chart provides a clear overview of the project’s resources and their workload level. It allows you to quickly identify which people are overloaded and which ones have remaining availability.
With this information, you can adjust the deadlines of tasks as needed to optimize resource allocation and workload distribution.
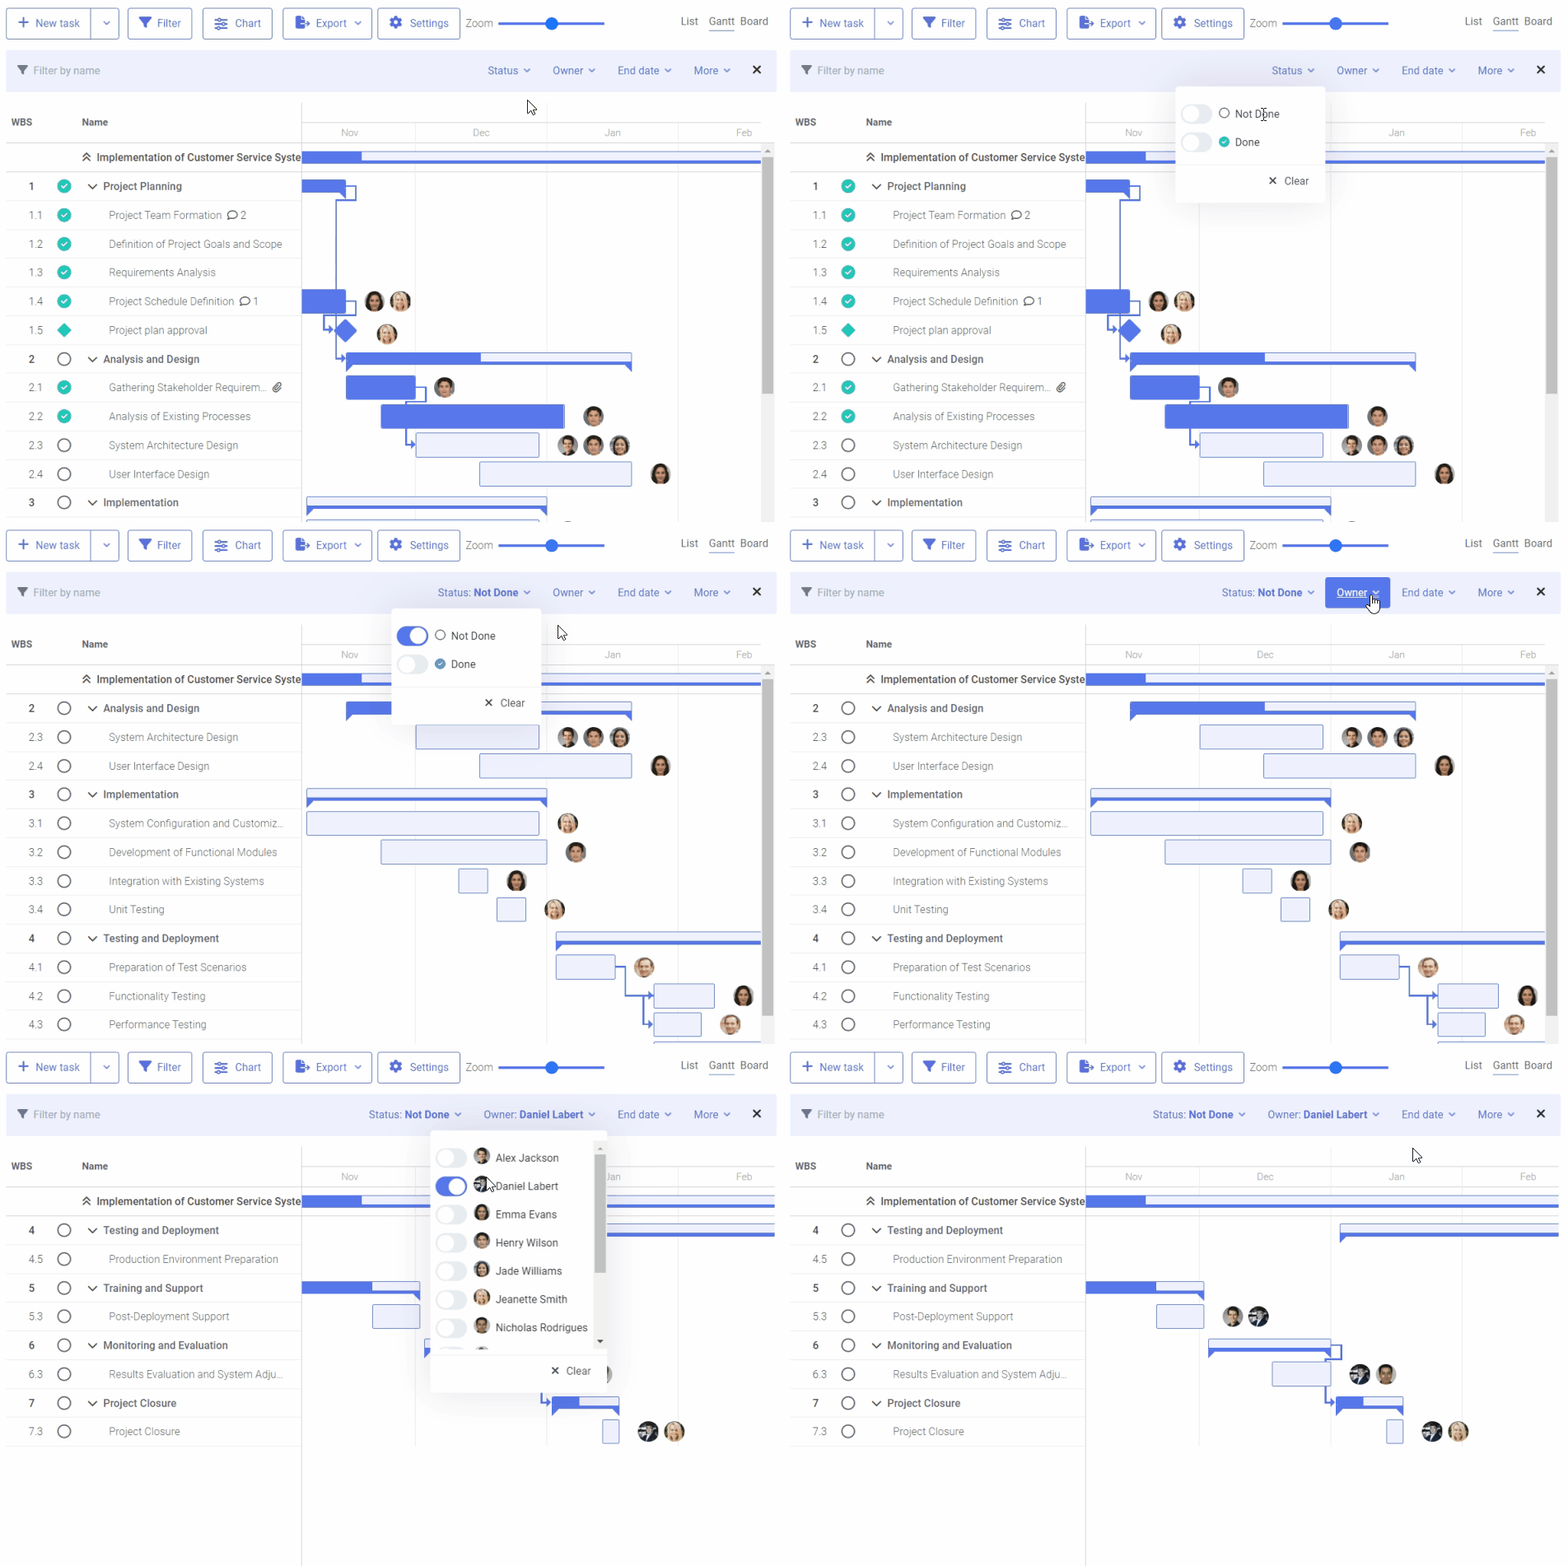
Filter and export Gantt chart
FlexiProject lets you personalize the Gantt Chart by filtering it based on your desired parameters. This way, you can view completed tasks, outstanding tasks, tasks assigned to specific individuals, or any other criteria you may have.
The resulting schedule is easy to understand and can be exported to a file, facilitating efficient project management.
Monitor project progress in the best Gantt Chart software
Undoubtedly, the Gantt Chart is one of the most popular project management tools. This chart visually shows the schedule of a project. Primarily, it shows the project’s phases, stages, tasks, and milestones. Indeed, the most essential value of a Gantt chart is the ability to build logical relationships between tasks in a project. Most importantly, good project management software offers all kinds of possible relations between project tasks. These are beginning-beginning, beginning-end, end-beginning and end-end relationships. Of course, how relationships are built on the Gantt chart must be easy and intuitive. Once built, the relationships ensure that a change in one task affects the dependent tasks. In fact, a significant advantage of this chart is the ability to see how all tasks are distributed throughout the project.
FlexiProject is recognized as one of the best Gantt chart software solutions, offering unmatched ease of use and powerful functionality. The Gantt chart available in FlexiProject’s project management software has built-in all types of relationships between tasks. It provides several configurable and customizable options to suit the scale of the ongoing project. FlexiProject users can decide whether to observe task owners, task deadlines, or the critical path. Our Gantt Chart software’s huge advantage is the ability to observe deviations from the approved project plan. Thanks to this, the project manager will always know the projected project completion date and how it compares to the plan. An excellent value for the project manager and the Project Management Office staff is the ability to simultaneously observe the Gantt chart and the level of project resource loading. If the project manager observes that the selected resources are overloaded with work at some period, he can change the task deadlines. This makes scheduling critical resources much more accessible. Advanced Gantt Chart software lets you observe the dependencies between tasks from different projects. This is a handy feature for companies that manage project programs. To be widely used, a Gantt chart must be intuitive, offer a high degree of configurability, and ensure that the project logic is maintained once the relationships between tasks are built.
Display multiple projects on a single Gantt chart
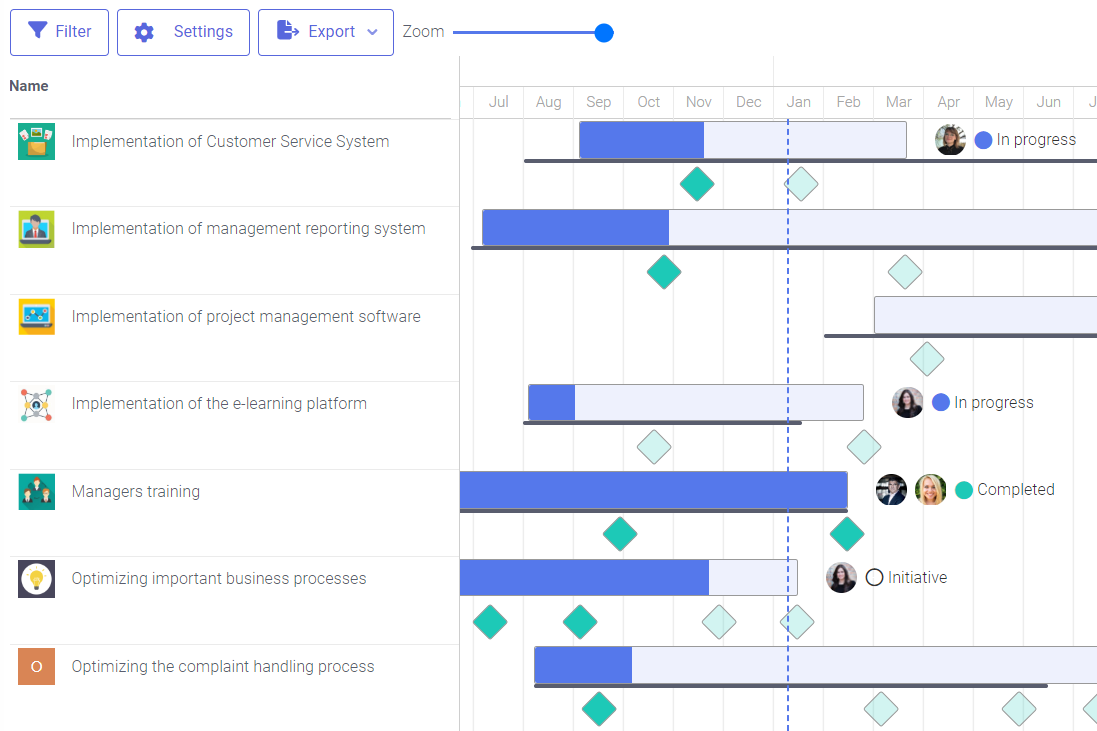
In a project portfolio, you can keep track of the schedules of multiple projects by using a common Gantt chart.
This will allow you to see dependencies between tasks from different projects, progress made on milestones, any deviations from the plan, and other information.
Contact us to learn more about FlexiProject details
If you want to explore the full capabilities that FlexiProject offers, feel free to talk to our specialists.