Construction Gantt chart: how to plan and control a build
A construction schedule rarely fails because of a single task; it fails through invisible dependencies between works. Installations wait for the structure, finishing waits for installations, inspections wait for everything at once, and one crew’s slip quietly moves the handover date. A construction Gantt chart puts that chain in order: it shows every work item on a timeline, links it to its predecessors and successors, and reveals which delays genuinely threaten the deadline and which only consume float. In this guide we show how to build a Gantt chart for a construction project using the phases of an investment as the example, how to read dependencies, the critical path and the baseline, and how a static template differs from an interactive chart in a project management system such as FlexiProject.

Key takeaways:
- Definition — a construction Gantt chart is the timeline of a build: every work item as a bar with dates, dependencies on other works and milestones, from the permit to handover inspections.
- Phase structure — summary tasks mirror the stages of a build (design, permits, foundations, structure, installations, finishing, handover), and a proven structure can be saved as a template for the next investments.
- Dependencies — four relation types between tasks and fixed lags, such as concrete curing time, mean that changing one date automatically recalculates the whole schedule.
- Control — the critical path shows the works that decide the handover date, and the baseline displayed next to the current schedule exposes every deviation from the approved plan.
- Scale — in a PPM system the Gantt chart also shows crew load across builds, and the milestones of all investments reach portfolio reports without opening the projects.
What is a construction Gantt chart?
A construction Gantt chart is a graphical schedule of a build: it takes the logic of a standard Gantt chart and applies it to construction works. Every work item is a horizontal bar on a timeline: the bar’s length shows the duration, and its position the start and end dates. Lines between the bars map the dependencies between works, and points marked as milestones indicate the key events of the build, from obtaining the permit to final inspections.
A complete construction Gantt chart consists of five elements: a task list grouped into stages, a timeline in days or weeks, work durations, dependencies between them, and milestones. Construction practice adds a sixth, often overlooked one: assigning every work item to an owner, crew or subcontractor, because a bar without a responsible person is just a graphic.
The drawing itself, however, is only the beginning. The chart’s value is decided by what happens to it after the plan is approved: does changing one date recalculate the dates of dependent works, are deviations from the original assumptions visible, and can the schedules of several builds be combined into one picture for management. These differences separate a static template from a Gantt chart in construction project management software, and we return to them later in this article.

Construction Gantt chart example: mapping the phases of a build
A construction schedule has a natural hierarchy, and the chart should mirror it directly. A typical building investment falls into a sequence of stages: design, permits and administrative decisions, site preparation, foundations, structure, installations, finishing, inspections and handover. Each stage breaks down into work packages, and those into individual tasks with dates and owners.
In FlexiProject such a structure is built from summary tasks with any number of levels. The dates of a stage follow from the dates of the works inside it, and the stage’s progress is calculated as an average weighted by sub-task duration, so the completion percentage of the structural stage always matches reality, without manual recalculation. The owner of a summary task automatically receives permissions to all works in the stage, so the structural works manager controls the whole block rather than individual rows.
The biggest benefit of a well-arranged structure shows on the second and subsequent investments. A proven hierarchy of stages can be saved as a project template, so the next build starts with ready scaffolding for its schedule instead of a blank page, and the projects in the portfolio become comparable because they share a common layout.

Dependencies and the critical path on a construction Gantt chart
Any spreadsheet can draw simple bars. Whether a Gantt chart is fit to run a build is decided by the logic of dependencies between works and by whether the system guards it on its own.
Four relation types and fixed lags, with construction examples
The relation “first A, then B” describes only part of the reality of a construction site. A full model needs four dependency types: finish-to-start (reinforcement starts after formwork), start-to-start (electrical and plumbing installations start together on the same floor), finish-to-finish (plasters and screeds must both finish before the joint stage inspection), and the rarer start-to-finish. On top of that come fixed lags, meaning a gap of a set number of days between works: the classic example is concrete curing, which must pass between pouring a slab and loading it, no matter how the rest of the schedule moves.
FlexiProject supports all four relation types along with a fixed lag defined in days and hard relations that the system enforces with every date change. Once the dependency network is built, moving one work item automatically recalculates the dates of dependent works and notifies their owners, including by email. The manager stops dragging bars by hand and checking what still needs fixing; the system guards the schedule logic, and the installation crew learns their work front is ready without a phone call.
The critical path: which delays move the handover date
Not every slip is dangerous. The critical path is the chain of works in which none has any float: a delay to any of them moves the date of the whole build. Works outside the path have float, and their slippage is safe up to a limit. Without this distinction, the manager fights every fire with equal force instead of watching the few works that genuinely decide the handover date.
On the Gantt chart in FlexiProject the critical path is switched on with a single toggle, and you immediately see which works it runs through today, because the system recalculates it after every date change. In construction practice this is a tool for daily decisions: whether to strengthen the crew on the structure, whether a joinery delivery slip will only consume float, and where to direct attention at the coordination meeting.

Baseline on the Gantt: comparing the plan with reality
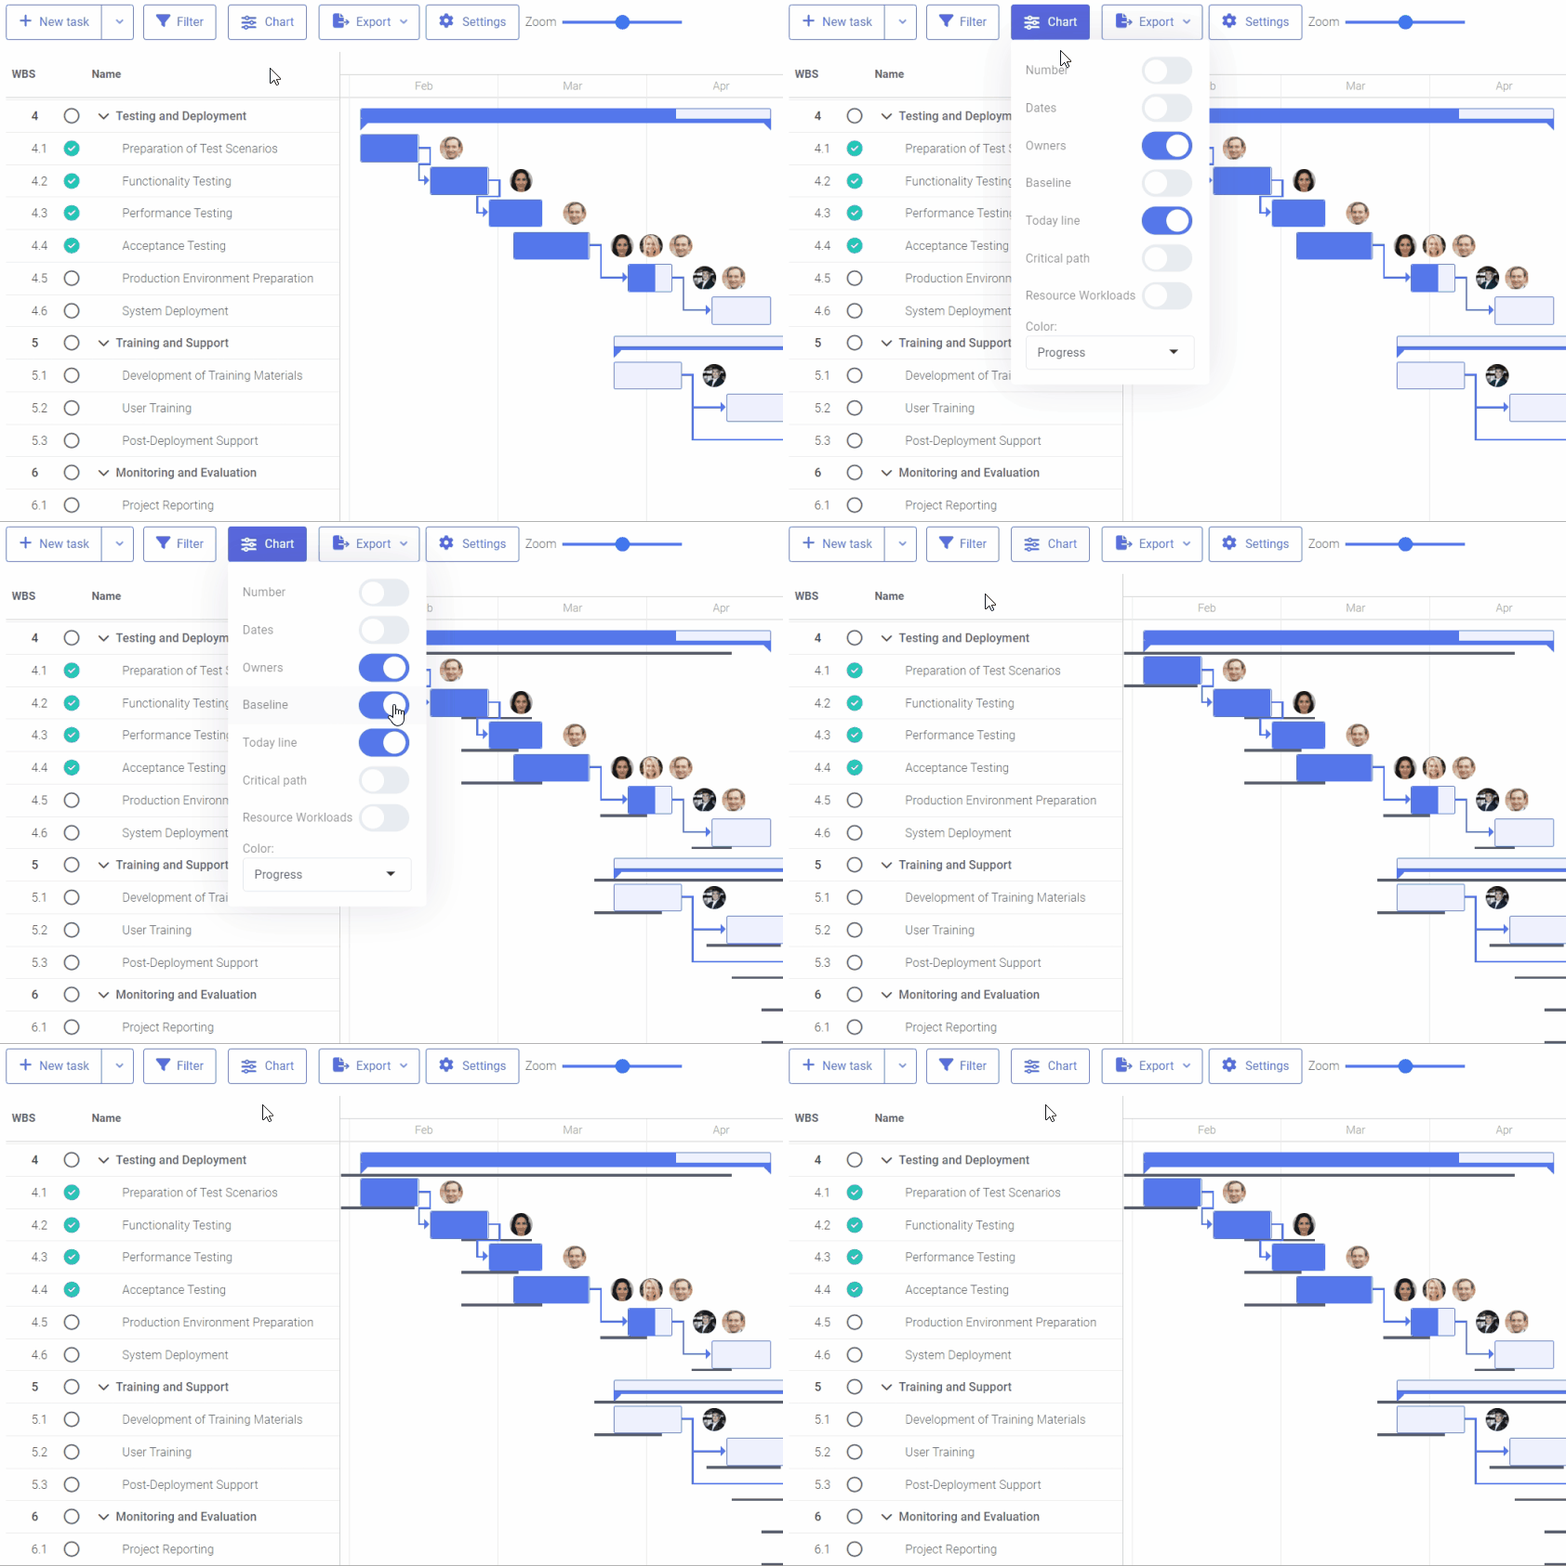
Once approved, a schedule immediately starts changing, and without a reference point nobody knows by how much. That is why the approved version of the plan is saved as a baseline: a fixed commitment against which date deviations are measured. FlexiProject keeps the original baseline and all subsequent approved versions, and displays the baseline on the Gantt chart in parallel with the current schedule, so every deviation is visible at once, work by work.
The system also shows the forecast end date of the whole build against the plan. This closes discussions that can otherwise run for hours: how far we have moved from the assumptions, when the investment will realistically finish, and whether the original plan was feasible at all. The answer takes a minute and is hard material for the steering committee, for the conversation with the investor, and in case of a dispute over the causes of delays.
Beyond one build: resources, milestones and the portfolio
Construction and investment companies rarely run a single build. The real value of a Gantt chart in a system shows only when data from many schedules works together.
Resource load visible on the Gantt across projects
The same reinforced-concrete crew, the same crane and the same site manager are sometimes planned on two builds at once, and the conflict surfaces only on site, where it costs downtime and contractual penalties. In FlexiProject, the resource management module shows resource load directly on the Gantt chart, across all projects: when planning to move works, you immediately see whether you are creating an overload on another build. A resource conflict surfaces at the planning stage, when it costs one conversation.
Milestones from the chart to portfolio reports
The main events of a build, such as obtaining the permit, completing the structural stage or the inspections, are worth marking on the chart as milestones. In a PPM system they do not stay on the drawing: the milestones of all builds are visible in reports and in the portfolio together with their status, the baseline date and the current deviation, without going into project details. The board gets the answer to which investments have milestones at risk, and by how much, in one view, and the report can be exported to Excel for a meeting.

Visualize your tasks with FlexiProject Gantt chart – get a full 30-day free access.
Construction Gantt chart template or Gantt chart software?
A static template in Excel or Google Sheets has its place: for one small build, a stable plan and a team that only needs a picture with bars, it is enough and costs the least. Problems begin where the real build begins: date changes that nobody recalculates along the dependencies; no baseline, so nobody knows how far the plan has drifted; no critical path; file versions circulating by email; and zero view of the second and third investment running in parallel.
Interactive gantt chart software solves exactly these points: dependencies recalculated automatically, a baseline with deviations, the critical path on demand, resource load, and milestones reported at portfolio level. The boundary is therefore practical, not ideological: a template for a sketch and small scale, a system for running the investments the company earns its living on.
The cost of switching is lower than habit suggests. FlexiProject imports schedules from MS Project .mpp files together with tasks, dependencies and owners, and project templates can also be fed from .xlsx files, so existing plans do not need to be retyped. A finished schedule can in turn be exported to PDF or PNG for a meeting or an investor report. How the Gantt chart fits the wider selection criteria is covered in our construction project management software buyer’s guide.
Frequently asked questions
What should a construction Gantt chart include?
A complete construction Gantt chart includes a list of works grouped into stages, dates and durations, dependencies between works, milestones for key events, and task owners. When run in a system, it adds a baseline with deviations, the critical path and resource load, which turn the chart into a tool for controlling the build rather than merely illustrating it.
What is the difference between a construction schedule and a Gantt chart?
A construction schedule is the plan of works with dates, dependencies and resources, while a Gantt chart is its graphical presentation on a timeline. In practice the two terms are often used interchangeably, because the Gantt chart is the most popular way of recording a schedule; the difference is that a schedule can also exist as a table or list, while the chart always shows it visually.
Can I make a construction Gantt chart in Excel?
You can, and for one small, stable build it may be enough. Excel, however, will not recalculate dates along dependencies, keep a baseline, determine the critical path or show crew load across several builds, and file versions quickly start circulating by email. With more than one investment, these gaps cost more than a system license.
How often should a construction Gantt chart be updated?
Work progress is best reported continuously, ideally from the site through a mobile app, while a review of the whole schedule should follow a steady rhythm, for example weekly or every two weeks at the coordination meeting. The key principle is that the chart reflects the actual state: an outdated schedule leads to worse decisions than no schedule, because it gives the illusion of control.
A construction Gantt chart is the simplest way to see a whole investment on one timeline, but its real value begins beyond the drawing. A task structure mirroring the phases of a build brings order to the plan and becomes a template for the next investments; four dependency types with fixed lags, such as concrete curing time, capture the real logic of the works; the critical path shows which slips genuinely move the handover; and a baseline displayed next to the current schedule turns arguments about delays into a conversation about data. In a company running more than one build, this is joined by crew load visible across projects and the milestones of all investments in a single report for the board. A static template will do none of these things, and that is the honest boundary of its use. FlexiProject combines an interactive Gantt chart with a baseline, resources, risks and the portfolio in one system, and imports MS Project schedules in minutes, so moving from a file to a system does not mean rebuilding plans from scratch. If the schedules of your builds still live in spreadsheets that someone has to reconcile by hand after every change, an interactive Gantt chart will probably be the fastest single improvement to deadline control in the whole company.